

Dear traders, I am glad to welcome you here! I’d like to demonstrate you my new technical indicator Trend Strength which determines the short-term trend strength. I put two simple and logical ideas of technical trend market analysis in the basis of the indicator. The first is that the ongoing trend is more likely to continue to move in the same direction than change it. And the second is that the trend will move in the same direction till it becomes weak. I found these ideas in Eric L. Nyman’s book “The Small Trader’s Encyclopedia”. What amazed me was that they …. actually work!

Indicator Operating Principle
Indicator Trend Strength helps analyze as trend resistance as its strength and compare this data with the average values with regard to each trend (upward and downward) separately. It makes the indicator very informative. You can have a look at information in a user-friendly graphic form on the screen.

Blue and red bars show the maximum strength of the upward (bull) and downward (bear) trend respectively within the analyzed period. Thin dark bars show the current trend strength and trend strength at the moment when the bar is closed.
The lines above and under the indicator graph show the average values of the maximum indicator values regarding the upward and downward trend within certain timeframe.
After the data is uploaded into the terminal, the indicator begins to memorize and analyze the incoming ticks (this means that the indicator works with the tick history) and show the expected value on the current bar. The indicator does not redraw and does not use the graph timeframes when it calculates the values of the current bars (only to illustrate and show the data on the history when it starts to work or when the timeframe is changed; in this case timeframe M1 is used).
Trading Strategy
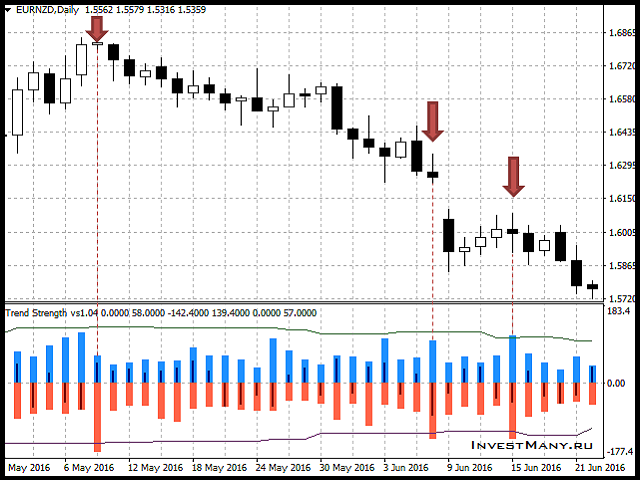
The indicator is developed for the platform Meta Trader 4. The indicator is an excellent tool for scalping. It can also be used in trading strategies when period D1 is used. During trading you should either use equivalent correlation between StopLoss and TakeProfit or an aggressive one when StopLoss is less than TakeProfit. The bigger the graph period, the bigger the history analyzed interval and the further you should put StopLoss and TakeProfit.
You should take the tools with the smallest spread (such as EURUSD, GBRUSD, etc.) for trading.
When the indicator was tested, I chose the time for trading when the traded currency pair was very volatile.
Indicator Trend Strength is displayed on 30-minute, 1-hour, 4-hour and day timeframes (M30, H1, H4 и D1). The signal of the indicator is the moment, when the strength of the current trend exceeds the maximum average value:
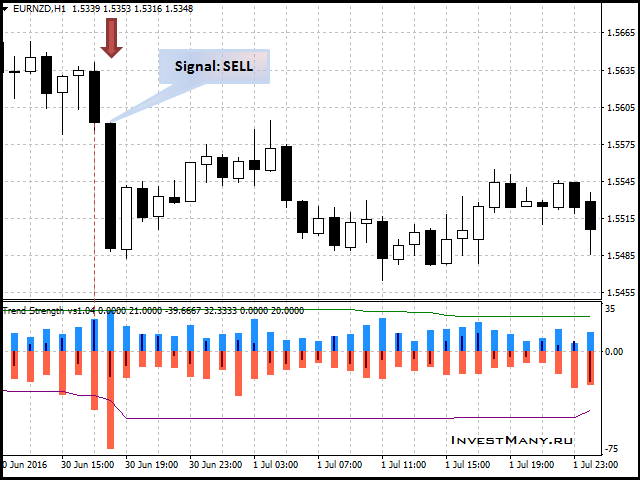

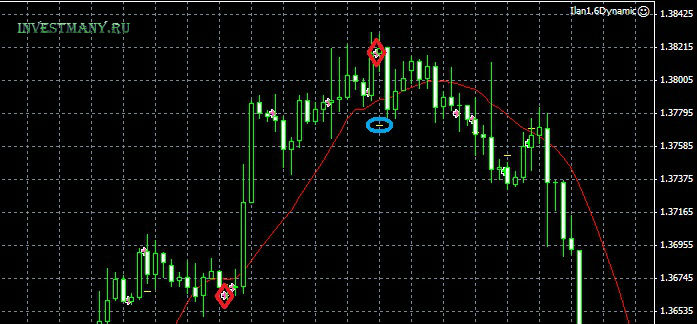
When one bar is formed, the indicator can give 2 signals in different directions. Both of them can be profitable. But in such cases I advise you filter the second signal further analyzing the maximum values of the upward and downward trends on the current and previous bars. For example, you can see an incoming signal at the moment of its arrival on the following screen shot, which you should skip:

For more convenient manual trading indicator Trend Strength makes a sound warning at the moment of signal arrival and also sends messages to an E-mail.
Indicator Parameters
Indicator has 6 input parameters.
The first 4 parameters are responsible for the calculation of average maximum (or needed) values of the bull or bear trend within the chosen historic period (a green or red line in the indicator window):
- To use different fixed numbers of the trend— if this parameter has the value “true”, the values of trend force are taken to draw the line. Their values should be either more or equal to the set value. If this parameter has the value “false”, the set number of bars with the highest values of trend force are taken for the calculation (for bull trend and bear trend separately);
- Fixed numbers of the trend— set value of trend force (the parameter is used when “To use different fixed numbers of the trend” = true);
- Number of bars to calculate average numbers — set number of bars with the highest values of trend force (the parameter is used when “To use different fixed numbers of the trend” = false);
- Number of bars for analysis — chosen historic period.
The last two parameters help send e-mail and sound note:
- To send an E-mail— send e-mail (On/Off);
- Give sound signal — sound note (On/Off).
The colors of lines and columns are chosen so that they would not blend with the chart background neither when the color scheme is light or dark.
I also considered the services necessary to create automatic trading system on the basis of Trend Strength. Initially I wanted to create a profitable adviser to trade myself and to create PAMM accounts. But to make sure that this will work, I decided to make an indicator first. I’m going to make an adviser soon. You can get the data from the indicator through indicator buffers, but in this case you will get the data, the indicator would use to draw, using one-minute bars making calculations (it calculates data on historic values in this way), when it trades on D1 timeframe, this is quite enough. As I have already written, after the loading the indicator begins to memorize data and work with tick history. For that reason in order to get precise information about current indicator values (this is especially important when you work on M30, H1, H4 timeframes) the indicator should be loaded in the window of the same graph, where Expert is operating. The current data should be taken from the global variables of the terminal, which the indicator creates.
The programmers have understood me well. You can get more information, using feedback. Those traders, who have not understood the information given in the last paragraph, should pay their attention to the following: there is a possibility in the indicator to create an automated expert on its bases.
In the following video there is a record of indicator testing in strategies tester of Meta Тrader 4 from 16.03.2016 up to 26.07.2016. Also the video gives guidelines how to filter false signals. Within the given period the indicator gave 18 signals on D1 timeframe for USD/CAD. 15 of them were profitable and 3 were false ones. You can filter 2 false and 1 profitable signals, if you use signal filter option, which is mentioned in the video.
The indicator can be bought on mql5.com. If you want, you can rent it for moderate price paid once a month to try the indicator in trade.


 Конфиденциальность гарантирована


Здравствуйте, у меня не получается скачать демо версию индикатора Trend Strength с mql5. Вы не могли бы скинуть его на мою почту Rostyslav70@yandex.ru. Спасибо.
Здравствуйте. А вкладка «Маркет», непосредственно в терминале у вас работает, там отображаются другие продукты? Такое может быть если Вы перемещали папку с установленным терминалом из того места, куда он был установлен первоначально, тогда Маркет у вас работать не будет. Вам нужно, чтобы путь к папке с терминалом оставался неизменным с момента установки, тогда Вы непосредственно из терминала перейдете в Маркет, найдете индикатор через поиск по названию и без труда скачаете демо версию. О результатах дайте знать пожалуйста, я вам дам настройки индикатора для тестирования, впрочем, на USDCAD он и по сей день дает хорошие сигналы с теми же настройками, что и в приложенном видео.